Category

News

Can a Hands-on Model Help Forest Stakeholders Fight Tree Disease?

By | News

When a new, more aggressive strain of the pathogen that causes sudden oak death turned up in Oregon, scientists and stakeholders banded together to try to protect susceptible trees and the region’s valuable timber industry.

Sudden oak death is a serious threat. Since 1994, the disease has killed millions of trees in California and Oregon. If the disease spreads from an isolated outbreak in Curry County, Oregon, to neighboring Coos County, the impact could be severe: a 15% reduction in timber harvest, loss of 1,200 jobs and about $58 million in lost wages, according to an Oregon Department of Forestry report.

Researchers with North Carolina State University’s Center for Geospatial Analytics reached out to help in Oregon, offering Tangible Landscape, an interactive model that allows people of all skill levels to control complex simulation models with their hands and collaboratively explore scenarios of management decisions.

While predictive models can provide useful forecasts about where the pathogen may go, they can be tough to work with, requiring coding or technical software experience, says Devon Gaydos, lead author of an article in Philosophical Transactions of the Royal Society B: Biological Sciences and an NC State doctoral student.

“The Tangible Landscape system makes it a lot easier because people can interact with the model by touch instead of through the code or the computer,” Gaydos says. “People can add objects to a 3D model of the landscape to represent different types of management, and then with the click of a button we see how that action may affect the disease’s spread within a few moments.”

The model also allows participants to factor in budgets for disease management to try out different approaches to stop its spread, both on a large and small scale, Gaydos says.

“You can think of our disease spread model like a weather forecast: Knowing what the weather may look like this afternoon can help you decide if you want to bring an umbrella to work,” she explains. “Similarly, knowing how the pathogen may spread over the next year can help people gather resources, figure out which areas to target for surveillance or management, and request funding.”

Researchers took a participatory modeling approach because the disease could affect many stakeholders in Oregon – private landowners, timber producers, U.S. Forest Service managers, tribal groups that consider tanoak trees sacred, and thousands of local residents, including those employed in the timber industry. They began by working with a dozen local and regional experts, in the spirit of learning from each other.

“The idea of co-creating models with stakeholders is that by involving the people who are most affected, you’re going to get better data as a scientist because they have a lot of information about local dynamics and on-the-ground management that you may not know,” Gaydos says.

“It’s all about working together as partners to frame questions and problems, improve models and decide how to use those results for sustainable solutions,” adds co-author Ross Meentemeyer, NC State Forestry and Environmental Resources professor and director of the Center for Geospatial Analytics.

In this case, the team found out that some of the data used in the model needed to be more accurate at a fine scale – a problem participants could help with. In addition, the model needed to show the impact of decisions at more frequent intervals to capture the complexity of field operations.

The team also learned that collective action is paramount. Meentemeyer notes that “just a few uncooperative landowners ‘opting out’ of management could allow the pathogen to escape quarantine and the put the region at huge economic risk.”

After making adjustments, researchers plan to use an updated version of Tangible Landscape with a larger group of stakeholders in Oregon, as well as pursuing new research.

“More and more stakeholders are becoming interested in using the model, and the Oregon Department of Forestry wants to use it in an economic analysis of the situation and to test different management scenarios for the future,” Gaydos says.

“We are excited to collaborate with more teams and apply our modeling approach to forecast and control emerging infectious diseases of other plant, animal and human populations,” Meentemeyer says.

The article, “Forecasting and control of emerging infectious forest disease through participatory modelling,” appears in Philosophical Transactions of the Royal Society B: Biological Sciences. Co-authors include Anna Petrasova of NC State’s Center for Geospatial Analytics, Richard C. Cobb of California Polytechnic State University and Meentemeyer.

Read the paper: Philosophical Transactions of the Royal Society B: Biological Sciences

Article source: North Carolina State University

Image: Danny Norlander, Oregon Department of Forestry

Study reports breakthrough to measure plant improvements to help farmers boost production

By | News

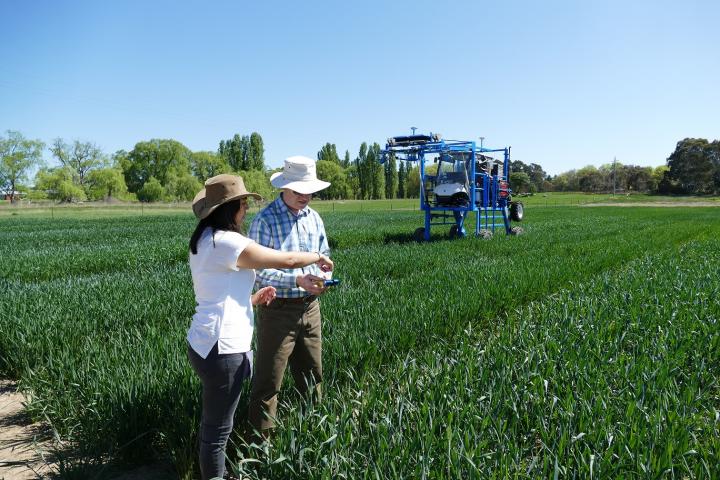
An international team is using advanced tools to develop crops that give farmers more options for sustainably producing more food on less land. To do this, thousands of plant prototypes must be carefully analyzed to figure out which genetic tweaks work best. In a special issue of the journal Remote Sensing of Environment, scientists have shown a new technology can more quickly scan an entire field of plants to capture improvements in their natural capacity to harvest energy from the sun.

“The method we developed allows us to measure improvements we have engineered in a plant’s photosynthesis machinery in about ten seconds, compared to the traditional method that takes up 30 minutes,” Katherine Meacham-Hensold, a postdoctoral researcher at the University of Illinois, who led this work for a research project called Realizing Increased Photosynthetic Efficiency (RIPE). “That’s a major advance because it allows our team to analyze an enormous amount of genetic material to efficiently pinpoint traits that could greatly improve crop performance.”

RIPE, which is led by Illinois, is engineering crops to be more productive by improving photosynthesis, the natural process all plants use to convert sunlight into energy and yield. RIPE is supported by the Bill & Melinda Gates Foundation, the Foundation for Food and Agriculture Research (FFAR), and the U.K. Government’s Department for International Development (DFID).

The traditional method for assessing photosynthesis analyzes the exchange of gases through the leaf; it provides a huge amount of information, but it takes 30 minutes to measure each leaf. A faster, or “higher-throughput” method, called spectral analysis, analyzes the light that is reflected back from leaves to predict photosynthetic capacity in as little as 10 seconds.

“The question we set out to answer is: can we apply spectral techniques to predict photosynthetic capacity when we have genetically altered the photosynthetic machinery,” said RIPE research leader Carl Bernacchi, a scientist with the U.S. Department of Agriculture, Agricultural Research Service, who is based at Illinois’ Carl R. Woese Institute for Genomic Biology. “Before this study, we didn’t know if changing the plant’s photosynthetic pathways would change the signal that is detected by spectral measurements.”

Although they can prove this method can be used to screen crops that have been engineered to improve photosynthesis, researchers have not uncovered what spectral analysis measures exactly. “Spectral analysis requires custom-built models to translate spectral data into measurements of photosynthetic capacity that must be recreated each year,” Meacham said. “Our next challenge is to figure out what we are measuring so that we can build predictive models that can be used year after year to compare results over time.”

“While there are still hurdles ahead, spectral analysis is a game-changing technique that can be used to assess a variety of photosynthetic improvements to single out the changes that are most likely to substantially, and sustainably, increase crop yields,” said RIPE executive committee member Christine Raines, a professor of plant molecular physiology at the University of Essex, whose engineered crops were analyzed with the technique. “These tools can help us speed up our efforts to develop high-yielding crops for farmers working to help feed the world.”

Read the paper: Remote Sensing of Environment

Article source: RIPE

Image: Beau Barber/University of Illinois

How plants are working hard for the planet

By | News

As the planet warms, plants are working to slow the effect of human-caused climate change – and research published in Trends in Plant Science has assessed how plants are responding to increasing carbon dioxide (CO2).

“We know that terrestrial plants are currently absorbing more CO2 than is released into the atmosphere through the combination of fire, decomposition, plant respiration, and land-use change,” lead researcher Lucas Cernusak said.

“This is commonly known as the land carbon sink, and we know it’s currently slowing the rate at which atmospheric CO2 is increasing. What we don’t know is how strong that response is, and how long we can count on it. This research is a first step towards answering those questions.”

Associate Professor Cernusak, a terrestrial ecologist at James Cook University in Cairns, Australia, worked with colleagues from CSIRO Oceans and Atmosphere in Canberra and the French National Institute for Agricultural Research (INRA) to measure the strength of the terrestrial biosphere’s response to increasing CO2.

They focussed on photosynthesis – the process in which plants capture energy from the sun and use it to synthesize carbohydrates from CO2 and water – and examined terrestrial gross primary productivity (GPP), a measure of global photosynthesis.

Their modelling and analysis revealed that, since the beginning of the industrial era, photosynthesis has increased in nearly constant proportion to the rise in atmospheric CO2.

“We expected the two would corelate, since CO2 stimulates photosynthesis, but given the complexity of plant and environmental interactions we were impressed by how closely they have kept pace,” Associate Professor Cernusak said.

“We can say that plants are working hard –the response is at the highest end of the expected range.”

The researchers used a combination of existing analyses and new modelling, alongside laboratory studies, to examine how increased CO2 affects photosynthesis, from individual leaves up to a global scale.

“This is an important step forward in the long and complex task of gauging how terrestrial vegetation will respond to climate change in the longer term,” Associate Professor Cernusak said.

While increased CO2 has allowed an increase in photosynthesis and global leaf area, the researchers warn that further climate change – with increasing frequency of events such as heat waves, droughts and storms – has the potential to significantly stress terrestrial vegetation and decrease production.

“It’s also important to remember that global change will manifest differently in different regions,” Associate Professor Cernusak said.

“Our observations and modelling analyses suggest that in high latitude ecosystems it’s global warming that is driving the increase in leaf area and growing-season length.

“That’s quite different from the tropics, where our study indicates that CO2 fertilisation is driving the growth in photosynthesis, while climbing temperatures can create significant stress for some plant species.”

The researchers’ focus is now on the future.

“Looking back over time has answered one of the questions we started out with. We’re seeing a robust response from terrestrial ecosystems, or the land carbon sink, to increasing CO2.” Dr Cernusak said.

“The next step is to use what we’ve learnt, to develop ways to better predict how terrestrial ecosystems will interact with future changes in the global carbon cycle. That would help us answer that second question: how long can we count on plants to slow the rate at which atmospheric CO2 is increasing?”

Read the paper: Trends in Plant Science

Article source: James Cook University

Image: James Cook University

A global map to understand changing forests

By | News

An international collaboration of hundreds of scientists – led in part by the Forest Advanced Computing and Artificial Intelligence (FACAI) Laboratory in Purdue’s Department of Forestry and Natural Resources – has developed the world’s first global map of tree symbioses. The map is key to understanding how forests are changing and the role climate plays in these shifts.

The findings, reported today in the journal Nature, come from the Global Forest Biodiversity Initiative (GFBI), a consortium of forest scientists and practitioners of which the FACAI Lab is a key hub and global center. Jingjing Liang, a Purdue University assistant professor of quantitative forest ecology, is co-supervisor of the FACAI Lab, coordinator and co-founder of the GFBI and co-lead author of the paper. Mo Zhou, a Purdue assistant professor of forest economics and management, is a senior author of the paper, co-supervisor of the FACAI Lab and lead economist of the GFBI.

Purdue’s FACAI Lab employs artificial intelligence and machine learning to study global, regional and local forest resource management and biodiversity conservation. For this research, FACAI compiled species abundance data from 55 million tree records in 1.2 million forest sample plots spanning 110 countries. The organization of the data was integral to developing the global map.

“The map and underlying global forest inventory database will serve as the foundation for research on the environmental impacts of forest changes, biological conservation and forest management,” Liang said.

The map identifies the types of mycorrhizal fungi associated with trees in a particular forest. These fungi attach to tree roots, extending a tree’s ability to reach water and nutrients while the tree provides carbon necessary for the fungi’s survival. The two most common types of mycorrhizae are arbuscular, which grow inside the tissues of tree roots and are associated with tree species such as maple, ash and yellow poplar, and ectomycorrhizal, which live on the outside of roots and are associated with tree species such as pine, oak, hickory and beech.

Those associations are important because the mycorrhizae affects the trees’ ability to access nutrients, sequester carbon and withstand the effects of climate change.

“Managing forests for climate change mitigation and sustainable development, therefore, should go well beyond managing only trees,” Zhou said.

The authors found that climate is the most significant factor affecting the distribution of mycorrhizae. A warming climate is reducing the abundance of ectomycorrhizal tree species by as much as 10 percent. That change is altering forests’ ecological and economic footprints, especially along the boreal-temperate ecotone, the border areas between colder and warmer forest. Losses to ectomycorrhizal species have implications for climate change since these fungi increase the amount of carbon stored in soil.

“Knowing the species composition in the forested area across the world is an important start,” Liang said. “There are many fundamental and socioeconomic questions we can answer now with GFBI data and cutting-edge machine learning techniques.”

The FACAI lab is currently developing collaborations to explore questions about ecology and economics, including self-learning forest models, innovative approaches to biodiversity valuation, locating unknown forest resources and space exploration.

The work aligns with Purdue’s Giant Leaps celebration, acknowledging the university’s global advancements made in health, space, artificial intelligence and sustainability as part of Purdue’s 150th anniversary. Those are the four themes of the yearlong celebration’s Ideas Festival, designed to showcase Purdue as an intellectual center solving real-world issues.

Brian S. Steidinger, a postdoctoral research fellow at Stanford University, and Thomas Ward Crowther, an assistant professor at ETH Zurich, are co-lead authors of the Nature paper with Liang. Sergio de Miguel, an assistant profession and principal investigator of the GFBI Hub at University of Lleida, Spain, and Xiuhai Zhao and Chunyu Zhang, professors at Beijing Forestry University, are among the senior collaborators of this paper.

Read the paper: Nature

Article source: Purdue

Image: Leonhard Steinacker

Amount of carbon stored in forests reduced as climate warms

By | News

Accelerated tree growth caused by a warming climate does not necessarily translate into enhanced carbon storage, an international study suggests.

The team, led by the University of Cambridge, found that as temperatures increase, trees grow faster, but they also tend to die younger. When these fast-growing trees die, the carbon they store is returned to the carbon cycle.

The results, reported in the journal Nature Communications, have implications for global carbon cycle dynamics. As the Earth’s climate continues to warm, tree growth will continue to accelerate, but the length of time that trees store carbon, the so-called carbon residence time, will diminish.

During photosynthesis, trees and other plants absorb carbon dioxide from the atmosphere and use it to build new cells. Long-lived trees, such as pines from high elevations and other conifers found across the high-northern latitude boreal forests, can store carbon for many centuries.

“As the planet warms, it causes plants to grow faster, so the thinking is that planting more trees will lead to more carbon getting removed from the atmosphere,” said Professor Ulf Büntgen from Cambridge’s Department of Geography, the study’s lead author. “But that’s only half of the story. The other half is one that hasn’t been considered: that these fast-growing trees are holding carbon for shorter periods of time.”

Büntgen uses the information contained in tree rings to study past climate conditions. Tree rings are as distinctive as fingerprints: the width, density and anatomy of each annual ring contains information about what the climate was like during that particular year. By taking core samples from living trees and disc samples of dead trees, researchers are able to reconstruct how the Earth’s climate system behaved in the past and understand how ecosystems were, and are, responding to temperature variation.

For the current study, Büntgen and his collaborators from Germany, Spain, Switzerland and Russia, sampled more than 1100 living and dead mountain pines from the Spanish Pyrenees and 660 Siberian larch samples from the Russian Altai: both high-elevation forest sites that have been undisturbed for thousands of years. Using these samples, the researchers were able to reconstruct the total lifespan and juvenile growth rates of trees that were growing during both industrial and pre-industrial climate conditions.

The researchers found that harsh, cold conditions cause tree growth to slow, but they also make trees stronger, so that they can live to a great age. Conversely, trees growing faster during their first 25 years die much sooner than their slow-growing relatives. This negative relationship remained statistically significant for samples from both living and dead trees in both regions.

The idea of a carbon residence time was first hypothesised by co-author Christian Körner, Emeritus Professor at the University of Basel, but this is the first time that it has been confirmed by data.

The relationship between growth rate and lifespan is analogous to the relationship between heart rate and lifespan seen in the animal kingdom: animals with quicker heart rates tend to grow faster but have shorter lives on average.

“We wanted to test the ‘live fast, die young’ hypothesis, and we’ve found that for trees in cold climates, it appears to be true,” said Büntgen. “We’re challenging some long-held assumptions in this area, which have implications for large-scale carbon cycle dynamics.”

Read the paper: Nature Communications

Article source: University of Cambridge

Image: Ulf Buntgen

Rice blast fungus study sheds new light on virulence mechanisms of plant pathogenic fungi

By | News

Rice blast fungus (Magnaporthe oryzae) is a global food security threat due to its destruction of cultivated rice, the most widely consumed staple food in the world. Disease containment efforts using traditional breeding or chemical approaches have been unsuccessful as the fungus can rapidly adapt and mutate to develop resistance. Because of this, it is necessary to understand fungal infection-related development to formulate new, effective methods of blast control.

A group of scientists at Nanjing Agricultural University and Louisiana State University Health Sciences Center examined the fungal cell biology of rice blast fungus pathogenesis and recently published the first systematic and comprehensive report on the molecular mechanism of the actin-binding protein (MoAbp1) that plays a crucial role in the pathogenicity of the fungus.

Through ongoing research, these scientists found that rice blast fungus forms a specialized infection structure that applies mechanical force to rupture the rice leaf cuticle. Once inside the host, the infection proliferates by living off the plant’s nutrients. These two processes are enabled by the actin-binding protein (MoABp1) that links an actin-regulating kinase (MoArk1) and a cyclase-associated protein (MoCap1) to an actin protein (MoAct1). These processes are necessary for the growth and perseverance of the fungus.

On a large scale, these findings shed a new light on the eukaryotic cell biology and virulence mechanisms of plant pathogenic fungi. On a smaller scale, these findings could reveal novel approaches or targets for anti-blast fungus management.

Rare crops crucial to protect Europe’s food supply, boost health

By | News

Rye bread or porridge oats may not be everyone’s first choice of breakfast, but scientists say Europeans need to broaden their taste in cereals both to boost their own health and to protect the future of Europe’s farming.

Wheat makes up nearly half of all cereals grown in the EU. The rest is mainly maize and barley.

Although Europe’s strategy to focus on a few high-yielding plants has produced bumper harvests, the lack of genetic variation means the crops are more susceptible to disease, pests and drought, scientists say.

‘If we rely on only one crop we are very vulnerable,’ said Dr Dagmar Janovská, curator of minor crops at the Prague-based Crop Research Institute in the Czech Republic.

‘We should learn from our history and grow a lot of different crops,’ she added, referring to Ireland’s potato famine in the mid-19th century. At the time, most Irish farmers grew just potatoes. When disease wiped out the country’s crop, it led to widespread starvation.

Dr Janovská coordinated a Europe-wide project to help boost the breeding and popularity of minor cereals rye, oat, spelt, emmer and einkorn.

Researchers on the HealthyMinorCereals project evaluated more than 1,700 genotypes – sets of genes in a plant’s DNA – for specific traits including yield, nutritional quality and resistance to disease. They carried out field experiments in Estonia, the UK, the Czech Republic and Crete.

‘We would like to improve breeding programmes in Europe (of minor cereals),’ Dr Janovská said.

The project’s results should help breeders develop varieties of cereal – including common wheat – which are better suited to the changing climate and need fewer pesticides. For example, the researchers found one genotype of spelt that is resistant to a fungus called fusarium head blight.

Globally, more than 6,000 plant species have been cultivated for food, but just nine of these account for 66% of the world’s crop production, according to the UN’s Food and Agriculture Organization (FAO).

Growing a diverse range of crops and cutting the amount of chemical inputs is better for the environment, and the health of the soil. ‘If we harm (Europe’s) ecosystems … we can assume we will have a very big problem in producing any food. Everything is interconnected,’ Dr Janovská said.

‘We should learn from our history and grow a lot of different crops.’ said Dr Dagmar Janovská, Crop Research Institute, Prague, Czech Republic.

Health-boosting

Some of the minor cereals contain more health-boosting nutrients like iron, zinc and antioxidants compared to common wheat, the researchers found.

‘The more diverse our food, the better. And spelt, rye and oat are very beneficial for our health, for example in lowering cholesterol,’ said Dr Janovská.

They also need fewer chemical inputs and can grow in relatively poor soil.

Common wheat expanded with the mechanisation of farming in the last century. It is high yielding – it produces large quantities of grain per hectare of land – and easy to process into flour.

It has expanded even in countries like the Czech Republic where people traditionally eat rye bread. Wheat makes up more than 60% of cereals grown there now, up from 18% in 1920. Over the same period, rye production has fallen to just 2%, from 35% in 1920, according to Dr Janovská.

‘That change is mainly because wheat is easier to grow,’ said Dr Janovská.

Fears about the lack of diversity on farms are widespread, even affecting traditional farmers working on small farms high up in the Andes mountains in South America. Some of them are ditching a wide variety of crops in favour of quinoa, a lucrative ‘superfood’ which has become popular in Europe and North America.

Taste

Some scientists hope that Europeans – as well as Americans – will expand their taste for other foods from the mountains in Peru, Bolivia and Ecuador.

Many of them, like quinoa, are high in protein and good for vegetarians, diabetics and people with gluten allergies.

‘I think Europe is a great market … because (these kinds of foods are) what people are looking for and what the European market can pay for,’ said Dr Gabriela Alandia Robles, a researcher in high-protein crops at the University of Copenhagen, Denmark.

Europe is the second largest market for quinoa after the United States. Other comparable foods from the Andes could follow a similar trend, she said.

Dr Alandia Robles worked on a project called Latincrop which aimed to increase Andean crops’ production and consumption both locally and in Europe.

Hot on the heels of quinoa is amaranth. The tiny grain has a nutty flavour and can be cooked like risotto rice or made into popcorn.

‘It has the whole range of amino acids that your body needs,’ said Dr Alandia Robles. It also is good for diabetics and people allergic to gluten, and has important amounts of folic acid, calcium, phosphorous and iron, she added.

The Andean lupin also has potential. ‘Europe is looking for a high protein crop, and Andean lupin has as much protein as soya bean – 51%,’ said Dr Alandia Robles. Its beans can be made into a kind of hummus.

One chef promoting these foods in Europe is Simon Brammer who, together with his wife Janice Pelayo Hansen, cook Peruvian food for weddings and corporate events in Denmark. They are passionate about sharing the nutritious foods with as many people as possible.

‘When we started Panca (a food truck) in 2016, it was a totally new thing. Some people hadn’t even heard of Peru … They were surprised by the flavours,’ Pelayo Hansen said.

Their dishes include a spicy chicken dish served with biscuits made from arracacha roots grown around Titicaca lake, and a quinoa salad popular with their vegetarian customers.

Cookbook

If European demand is to grow for both Andean foods and locally grown cereals, people need to know how to cook them. To help with this, the Latincrop project produced a cookbook, and the HealthyMinorCereals project is planning one too.

Dr Janovská’s favourite cereal from the project is spelt. ‘At Christmas we make cookies out of spelt flour, because the taste is better,’ she said, adding that its fibre content makes it healthier.

‘We need to improve demand, and then we can ask our farmers to grow it … If you want to improve anything on the field, you have start with the fork,’ she said.

Article source: Horizon Magazine

Image: Pixabay

New research accurately predicts Australian wheat yield months before harvest

By | News

Topping the list of Australia’s major crops, wheat is grown on more than half the country’s cropland and is a key export commodity. With so much riding on wheat, accurate yield forecasting is necessary to predict regional and global food security and commodity markets. A new study published in Agricultural and Forest Meteorology shows machine-learning methods can accurately predict wheat yield for the country two months before the crop matures.

“We tested various machine-learning approaches and integrated large-scale climate and satellite data to come up with a reliable and accurate prediction of wheat production for the whole of Australia,” says Kaiyu Guan, assistant professor in the Department of Natural Resources and Environmental Sciences at the University of Illinois, Blue Waters professor at the National Center for Supercomputing Applications, and principal investigator on the study. “The incredible team of international collaborators contributing to this study has significantly advanced our ability to predict wheat yield for Australia.”

People have tried to predict crop yield almost as long as there have been crops. With increasing computational power and access to various sources of data, predictions continue to improve. In recent years, scientists have developed fairly accurate crop yield estimates using climate data, satellite data, or both, but Guan says it wasn’t clear whether one dataset was more useful than the other.

“In this study, we use a comprehensive analysis to identify the predictive power of climate and satellite data. We wanted to know what each contributes,” he says. “We found that climate data alone is pretty good, but satellite data provides extra information and brings yield prediction performance to the next level.”

Using both climate and satellite datasets, the researchers were able to predict wheat yield with approximately 75 percent accuracy two months before the end of the growing season.

“Specifically, we found that the satellite data can gradually capture crop yield variability, which also reflects the accumulated climate information. Climate information that cannot be captured by satellite data serves as a unique contribution to wheat yield prediction across the entire growing season,” says Yaping Cai, doctoral student and lead author on the study.

Co-author David Lobell of Stanford University adds, “We also compared the predictive power of a traditional statistical method with three machine-learning algorithms, and machine-learning algorithms outperformed the traditional method in every case.” Lobell initiated the project during a 2015 sabbatical in Australia.

The researchers say the results can be used to improve predictions about Australia’s wheat harvest going forward, with potential ripple effects on the Australian and regional economy. Furthermore, they are optimistic that the method itself can be translated to other crops in other parts of the world.

Read the paper: Agricultural and Forest Meteorology

Article source: University of Illinois

Image: Mylene2401 – Pixabay

Scientists Create New Genomic Resource for Improving Tomatoes

By | News

Tomato breeders have traditionally emphasized traits that improve production, like larger fruits and more fruits per plant. As a result, some traits that improved other important qualities, such as flavor and disease resistance, were lost.

Researchers from Boyce Thompson Institute and colleagues from partnering institutions have created a pan-genome that captures all of the genetic information of 725 cultivated and closely related wild tomatoes, establishing a resource that promises to help breeders develop more flavorful and sustainable varieties.

As described in a paper published in Nature Genetics, the researchers found 4,873 new genes and identified a rare version of a gene that can make tomatoes tastier.

“The pan-genome essentially provides a reservoir of additional genes not present in the reference genome,” said Boyce Thompson Institute faculty member Zhangjun Fei. “Breeders can explore the pan-genome for genes of interest, and potentially select for them as they do further breeding to improve their tomatoes.”

The first tomato genome sequence was a large modern variety published in 2012, revealing approximately 35,000 genes and facilitating crop improvement efforts. Since then, several hundred additional tomato genotypes have been sequenced.

The current study is the first to mine all of these genome sequences—as well as another 166 new sequences generated by the researchers—to hunt for genes that were absent from the reference genome.

“During the domestication and improvement of the tomato, people mostly focused on traits that would increase production, like fruit size and shelf-life,” Fei said, “so some genes involved in other important fruit quality traits and stress tolerance were lost during this process.”

Indeed, the researchers found that genes involved in defense responses to different pathogens were the most common group of genes that were missing in the domesticated varieties of tomato.

“These new genes could enable plant breeders to develop elite varieties of tomatoes that have genetic resistance to diseases that we currently address by treating the plants with pesticides or other cost-intensive and environmentally unfriendly measures,” added James Giovannoni, a BTI faculty member and USDA scientist.

Giovannoni and Fei are co-corresponding authors on the paper and adjunct professors in Cornell University’s School of Integrative Plant Science.

In addition to recovering these “lost” genes, the researchers also analyzed the pan-genome to find genes and gene mutations that are rare among the modern cultivars.

This analysis identified a rare version of a gene, called TomLoxC, which contributes to a desirable tomato flavor. The rare version is present in 91.2% of wild tomatoes but only 2.2% of older domesticated tomatoes.

“The rare version of TomLoxC now has a frequency of 7% in modern tomato varieties, so clearly the breeders have started selecting for it, probably as they have focused more on flavor in the recent decades,” Giovannoni said.

The researchers also discovered a new role for the TomLoxC gene.

TomLoxC appears, based on its sequence, to be involved in producing compounds from fats,” said Giovannoni. “We found it also produces flavor compounds from carotenoids, which are the pigments that make a tomato red. So it had an additional function beyond what we expected, and an outcome that is interesting to people who enjoy eating flavorful tomatoes.”

Ultimately, the tomato pan-genome could benefit the economy and the consumer, according to Clifford Weil, program director of the NSF’s Plant Genome Research Program, which supported the work.

“How many times do you hear someone say that tomatoes from the store just don’t quite measure up to heirloom varieties?” Weil asked. “This study gets to why that might be the case and shows that better tasting tomatoes appear to be on their way back.”

Tomatoes are one of the most consumed vegetables in the world—although technically we eat their fruit—with 182 million tons worth more than $60 billion produced each year. Tomatoes also are the second most-consumed vegetable in the U.S., with each American consuming an average of 20.3 pounds of fresh tomatoes and 73.3 pounds of processed tomatoes each year.

Researchers from the University of Florida, Cornell, the U.S. Department of Agriculture, the Pennsylvania State University, the Polytechnic University of Valencia, the University of Georgia and the Chinese Academy of Agricultural Sciences also participated in the study.

Read the paper: Nature Genetics

Article source: Boyce Thompson Institute

Image: Mike Carroll

A late-night disco in the forest re­veals tree per­form­ance

By | News

A group of researchers from the University of Helsinki has found a groundbreaking new method to facilitate the observation of photosynthetic dynamics in vegetation. This finding brings us one step closer to remote sensing of terrestrial carbon sinks and vegetation health.

In 2017, the group from the Optics of Photosynthesis Lab (OPL) developed a new method to measure a small but important signal produced by all plants, and in this case trees. This signal is a called chlorophyll fluorescence and it is an emission of radiation at the visible and near-infrared wavelengths. Chlorophyll fluorescence relates to photosynthesis and the health status of plants, and it can be measured from a distance, for example from towers, drones, aircraft and satellites. Interpretation of the signal is, however, complicated and so far it has only been possible to measure it within discrete spectral bands from fully-grown trees in the field.

OPL devised a new technique that, for the first time, allowed them to observe from a distance the full spectrum (all colours) of fluorescence of mature trees growing in the forest. Measuring the whole spectrum of emission reveals information on both plant performance (how they photosynthesise) and the structure of the plants themselves.

The issue with conventional remote sensing methods used so far has been that during daytime, most of the fluorescence distribution remains hidden from view, as the signal is so weak compared to sunlight. Therefore measuring fluorescence during daytime, commonly referred to as Solar-Induced Fluorescence (SIF), requires extremely sensitive and specialised instrumentation. The new technique differs from these previous efforts by using commercially available LED technology, which literately lights up the forest at night to reveal the full spectrum of emission of whole trees.

“We realised we could use the night as a ‘natural light filter’, so we went into the forest at night and attached a strong wavelength-restricted light source (a commercial disco-type light) to a tower that excited the fluorescence. Next, we used specialist scientific instrumentation, a spectroradiometer, also mounted in the tower to observe the signal”, describes Jon Atherton, researcher from the University of Helsinki Optics of Photosynthesis Lab at the Institute for Atmospheric and Earth System Research (INAR) / Forest Sciences of the University of Helsinki.

Combining night and light simplifies things: measuring fluorescence at night can be done with potentially cheaper (less sensitive) instruments and it provides data that is easier to interpret.

The link between fluor­es­cence and ter­re­strial car­bon sinks

The researchers’ new contribution puts us one step closer to “observing photosynthesis” by looking at the light emitted by plants, both on smaller scales (greenhouse, crops, forest stand) but also globally using satellites. The European Space Agency is preparing the FLEX satellite mission, which aims to map fluorescence globally. The hope is that fluorescence will be used to routinely estimate plant photosynthesis from space, which is the process that drives the terrestrial carbon cycle.

The role of forests in the uptake and assimilation of atmospheric carbon is crucial and widely discussed in the media. Measuring the exchange of carbon dioxide between forests and the atmosphere is accomplished with expensive instrumentation in specific places (flux tower sites) which produce localised estimates of fluxes (carbon exchange) close to the sites. This is where fluorescence enters into play by providing a remote sensing friendly means of estimating photosynthesis across the landscape by filling in the coverage (gaps) between the stations. Interpreting the data is challenging, but with the Light Emitting Diode Induced Fluorescence (LEDIF) technique there should be a significant leap forward.

“It is the potential for measuring fluorescence from space that really motivated us to do this work, although our results could have other applications too such as phenotyping, precision farming or forest nurseries. We hope that our data can be used to inform algorithms used to ‘retrieve’ fluorescence from space. Such algorithms work in a slightly different way to our spectral technique as they exploit dark atmospheric ‘lines’ to estimate fluorescence. Hence, the full emission spectrum remains effectively hidden in satellite data, and that is what our data reveals”, Jon Atherton adds.

Read the paper: Remote Sensing of Environment

Article source: University of Helsinki

Image: Albert Porcar-Castell