Dr Colin Khoury
This post was written by Dr Colin Khoury. Colin studies diversity in the crops people grow and eat worldwide, and the implications of change in this diversity on human health and environmental sustainability. He is particularly interested in the wild relatives of crops. Colin is a research scientist at the International Center for Tropical Agriculture (CIAT), Colombia, and at the USDA National Laboratory for Genetic Resources Preservation in Fort Collins, Colorado.
New Changing Global Diet website explores changes in diets over the past 50 years in countries around the world.
One of the central concepts that unifies those concerned with biodiversity is the understanding that this diversity is being lost, piece by piece, to a greater or lesser degree, globally.
The same goes for the biodiversity of what we eat. Scientists and activists have worried about the loss of crops and their many traditional varieties for at least a hundred years, since botanist N. I. Vavilov traveled the world in search of plants useful for cultivation in his Russian homeland. He noticed that diversity was disappearing in the cradles of agriculture – places where crops had been cultivated continuously for thousands of years. The alarm sounded even louder 50 years ago, during the Green Revolution, when farmers in some of the most diverse regions of the world largely replaced their many locally adapted wheat, rice and other grain varieties with fewer, more uniform, higher yielding professionally bred varieties.
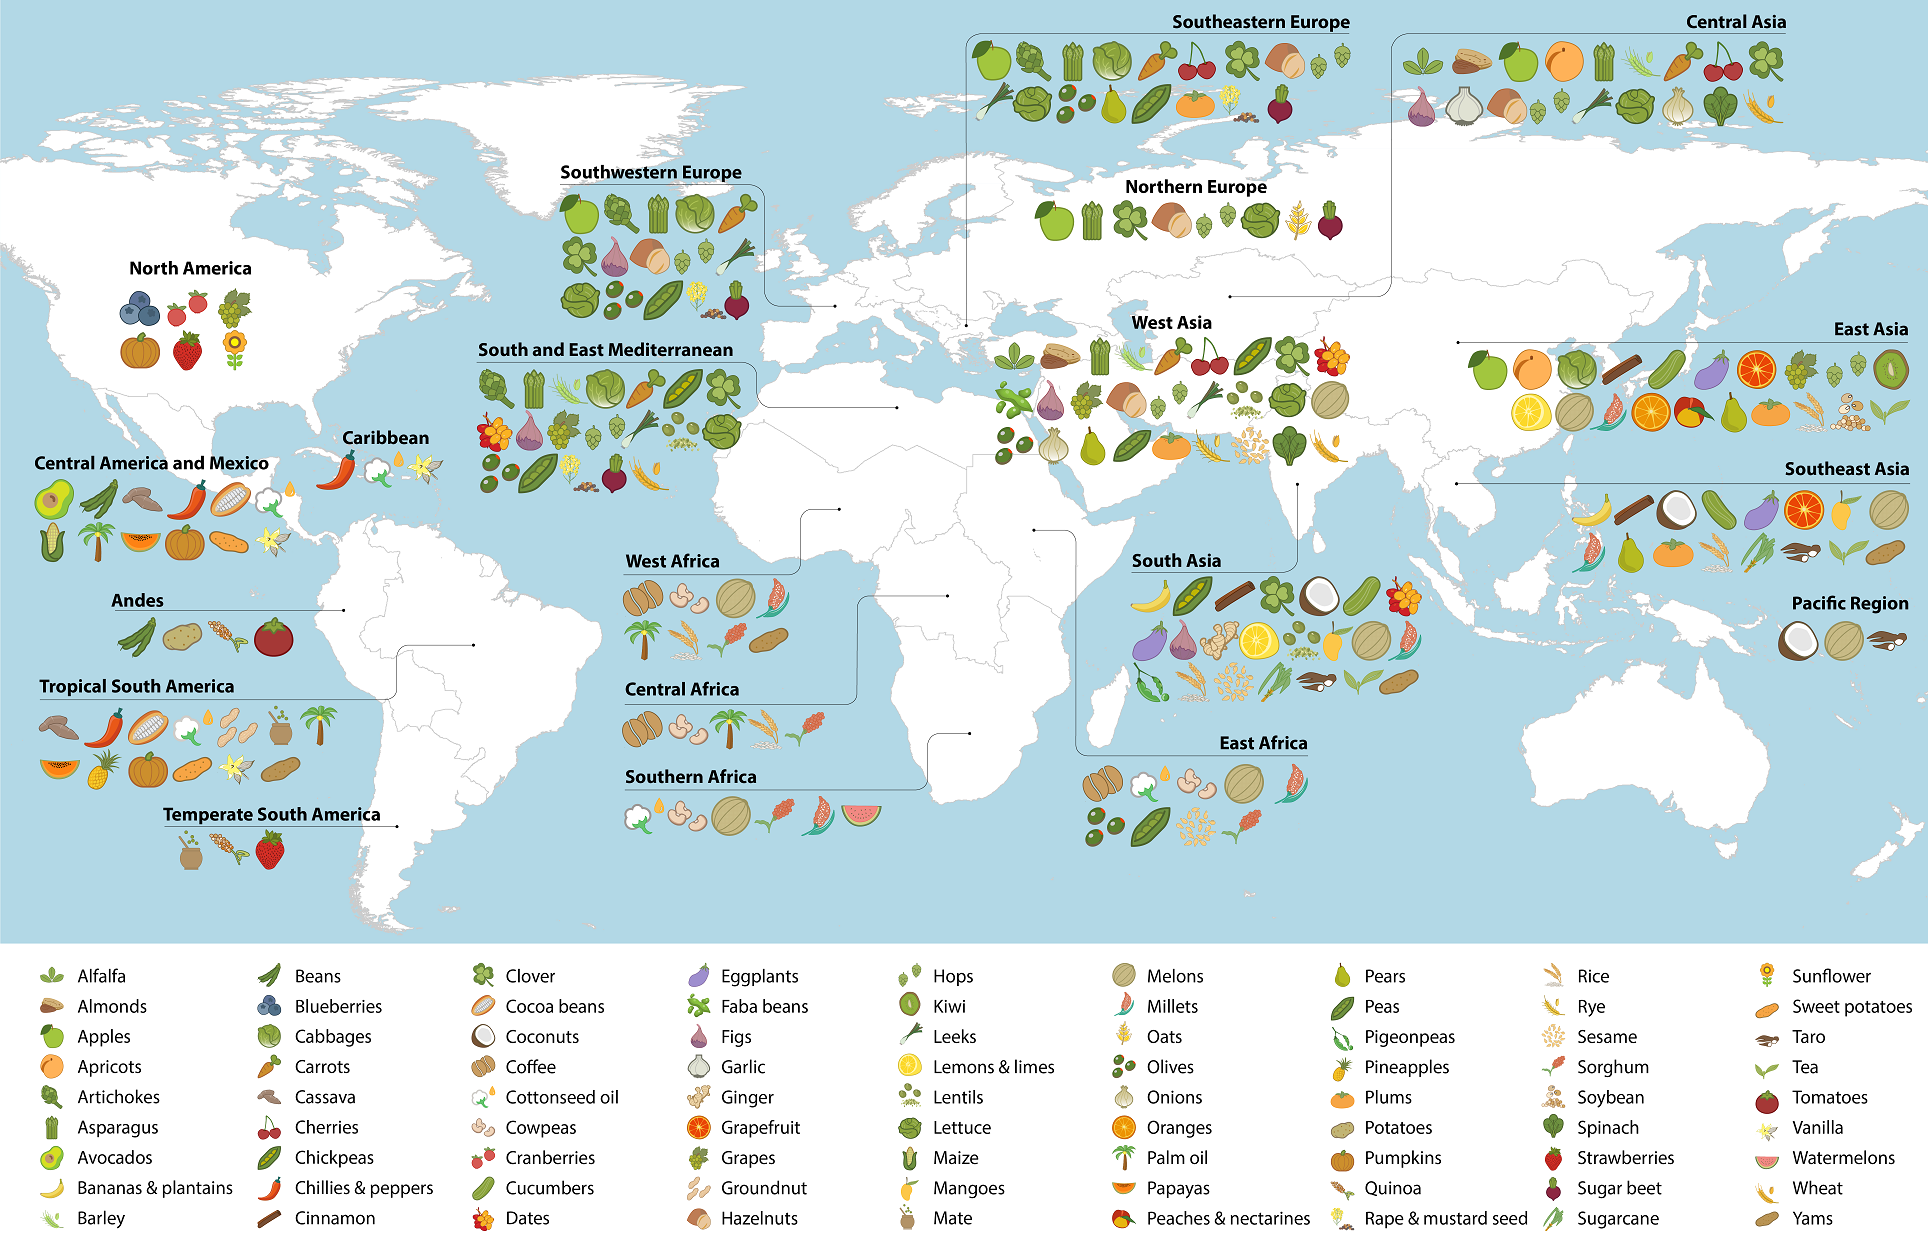
Cradles of agriculture: origins and primary regions of diversity of agricultural crops
(Click to magnify)
This is ironic, since modern productive crop varieties are bred by wisely mixing and matching diverse genetic resources. The disappearance of old varieties thus reduces the options available to plant breeders, including those working to produce more nutritious or resilient crops.
Being a food biodiversity scientist, I grew up (in the professional sense) with the loss of crop diversity looming over my head, providing both a raison d’être, and an urgency to my efforts. Somewhere along the line, I became interested in understanding its magnitude. That is, counting how many crops and how many varieties have been lost.
That’s where it started to become complicated, and also more interesting. Because, when I went looking for signs of the loss of specific crops, I couldn’t find any. Instead, I found evidence of massive global changes in our food diversity that left me worried, but at the same time hopeful.
A bit of background. Most of the numbers seen in the news on how much crop diversity has been lost go back to a handful of reports and books that reference a few studies: for example, the changing number of vegetable varieties for sale in the U.S. over time. The results are estimations for a few crops at local to national levels, but they somehow have been inflated to generalized statements about the global state of crop diversity, the most common of which being some variation of “75% of diversity in crops has been lost”.
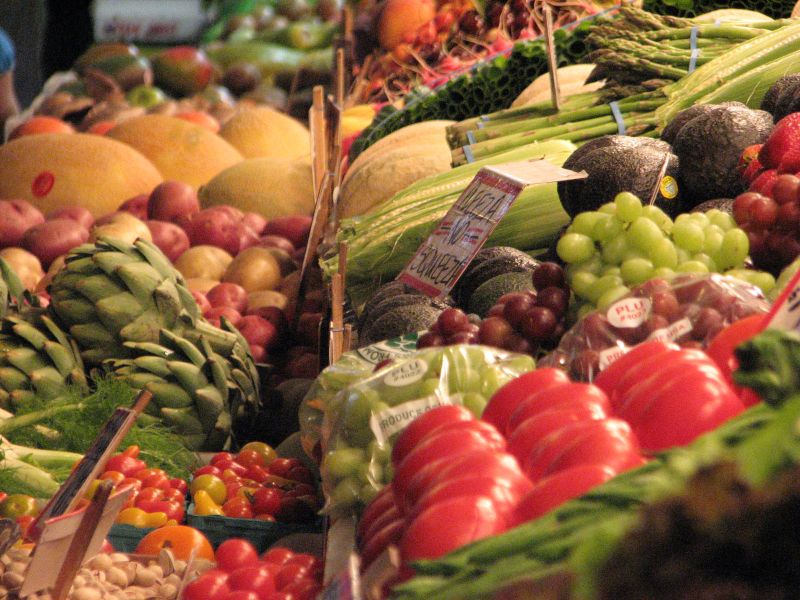
Diverse produce, but is it all local? Image credit: Karyn Christner. Used under license: CC BY 2.0.
Putting true numbers on diversity loss turns out to be a complicated and contested business, with no shortage of strong opinions. One big part of the problem is that there aren’t many good ways to count the diversity that existed before it disappeared. Researchers have done some work to assess the changes in diversity in crop varieties of Green Revolution cereals, and to some degree on the genetic diversity within those varieties. The results indicate that, although diversity on farms decreased when farmers first replaced traditional varieties with modern types, the more recent trends are not so simple to decipher.
It was particularly surprising to me that very little work had been done to understand the changes in what is probably the simplest level to measure: the diversity of crop species in the human diet, that is, how successful is maize versus rice versus potato versus quinoa and so on. I realized that data on the contribution of crops to national food supplies were available for almost all countries worldwide via FAOSTAT, with information for every year since 1961. Perhaps these were the data that could show when a crop fell off the world map.
Fast forward through a couple of years of investigation. To my great surprise, I found that not a single crop was lost over the past 50 years! There was no evidence for extinction. What was going on?
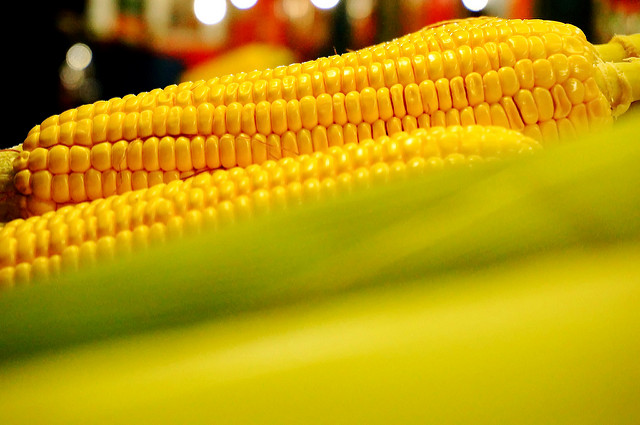
Maize is a key crop in many countries. Image credit: Erfan A. Setiawan. Used under license: CC BY 2.0.
It turns out that my failure to see any loss of crops was due to the lack of sufficient resolution in the FAO data. Only 52 meaningful crop species-specific commodities are measured and a number of these are general groupings such as “cereals, other”. Because of this lack of specificity, the data couldn’t comprehensively assess the crops that have been most vulnerable to changes in the global food system over the past 50 years. In FAO data, these plants are either thrown into the general categories or they aren’t measured at all, especially if they are produced only on a small scale, for local markets or in home gardens. This is, in itself, sign enough that they may be imperiled. We need better statistics about what people eat (and grow) around the world. But, enough is known to be confident that many locally relevant crops are in decline.
Over the past 50 years, almost all countries’ diets actually became more diverse, not less, for the crops that FAO statistics do report on. We found that traditional diets that were primarily based on singular staples a half century ago, for instance rice in Southeast Asia, had diversified over time to include other staples such as wheat and potatoes. The same was true for maize-based diets in Latin America, sorghum- and millet-based diets in sub-Saharan Africa, and so on.
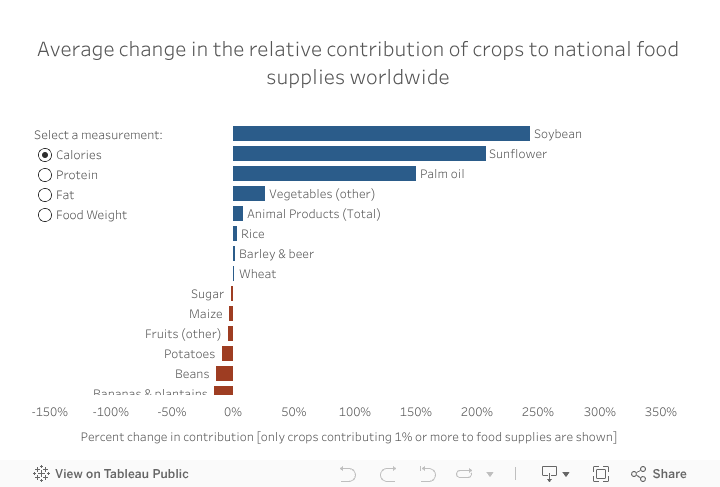
Not that there weren’t plant winners and losers. Wheat, rice, and maize, the most dominant crops worldwide 50 years ago, became more important globally. Other crops emerged as widespread staples, particularly oilcrops such as soybean, palm oil, sunflower, and rapeseed oil. And, as the winners came to take more precedence in food supplies around the world, alternative staples such as sorghum, millets, rye, cassava, sweet potato, and yam were marginalized. They haven’t disappeared (at least not yet), but they have become less important to what is eaten every day.
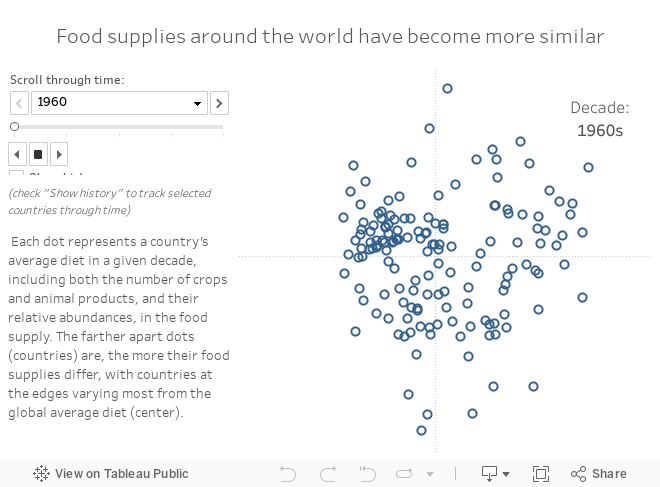
As countries’ food supplies became more diverse in the winner crops reported by FAO, and the relative abundance of these crops within diets became more even, food supplies worldwide became much more similar, with an average decrease in variation between diets in different countries of 68.8% over the past 50 years!
This is why, although we could see no absolute loss in crops consumed over the past 50 years, I am concerned. For even in the relatively small list of crops reported in the FAO data, many of these foods are becoming marginalized, day by day, bite by bite. That doesn’t seem like a good thing for the long-term resilience of our agricultural areas, nor for human health, although it’s important to remember that such changes are the collateral damage resulting from the creation of highly productive mega-crop farming systems, which have increased the affordability of these foods worldwide, leading to less stunting and other effects of undernutrition worldwide. On the other hand, global dependence on a few select crops equates to expansive monocultures, with more lives riding on the outcome of the game of cat and mouse between pestilence and uniform varieties grown over large areas. Moreover, cheaply available macronutrients have contributed to the negative effects of the nutrition transition, including obesity, heart disease and diabetes.
So why then am I hopeful? Because the data, and some literature, and my own direct experience also indicate that diets in recent years, in some countries, are beginning to move in different directions, reducing the excessive use of animal products and other energy-dense and environmentally expensive foods, and becoming more diverse, particularly with regard to fruits and vegetables, and even healthy grains. What better evidence than quinoa, which was relatively unknown outside the Andes a couple of decades ago, and is now cultivated in 100 countries and consumed in even more?
When we published our findings of increasing homogeneity in global food supplies, we hadn’t yet found a good way to make the underlying national-level data readily visible to interested readers. This is why I’m tremendously excited to announce the publication of our new Changing Global Diet website, which provides interactive visuals for 152 countries over 50 years of change. We that hope you will enjoy your own investigations of dietary change over time. Perhaps you can tell us where you think the changing global diet is headed.
Check out The Changing Global Diet website
Read the published article: Khoury CK, Bjorkman AD, Dempewolf H, Ramírez-Villegas J, Guarino L, Jarvis A, Rieseberg LH and Struik PC (2014). Increasing homogeneity in global food supplies and the implications for food security. PNAS 111(11): 4001-4006.