Rice is crucial for global food security, providing sustenance for half of the world’s population. Its production, particularly influenced by environmental factors during the heading-flowering stage, affects crucial growth traits. Traditional phenotyping methods are inefficient for large-scale analysis, necessitating advanced, accurate monitoring solutions. Recent advancements in computer vision and machine learning, especially deep learning, have improved plant phenotyping, with methods like the scale-invariant feature transform (SIFT) algorithm and convolutional neural networks aiding in rice panicle analysis. However, these techniques face limitations in capturing the dynamic growth of rice panicles over time. Addressing this gap requires combining field cameras with deep learning for detailed, real-time monitoring.
Recently Plant Phenomics published a research article entitled by “Analyzing Nitrogen Effects on Rice Panicle Development by Panicle Detection and Time-Series Tracking“.
In this study, researchers developed a pipeline utilizing YOLO v5, ResNet50, and DeepSORT models to automatically extract detailed panicle traits from time-series images. This method was tested for its ability to detect subtle differences in panicle development under varying nitrogen treatments. Results showed high accuracy in panicle counting (R2 = 0.96, RMSE = 1.73) and precise estimation of the heading date (absolute error of 0.25 days). Moreover, the method facilitated the analysis of flowering duration and individual panicle flowering times. This analysis revealed that increased nitrogen leads to more panicles, longer flowering durations, and earlier flowering initiation. The panicle detection model, evaluated against different nitrogen treatments, maintained consistent accuracy across years, indicating its universality for different rice varieties. It also effectively detected panicles with varying shapes, colors, and textures. For panicle classification, the ResNet 50-based model distinguished between vigorous and non-vigorous flowering panicles with high accuracy. This study facilitated the analysis of the rice flowering process and heading date identification, aligning closely with manual counts and field observations. Furthermore, the method effectively identified sensitive flowering changes due to environmental factors like temperature and humidity. The tracking of individual panicles revealed that higher nitrogen application led to earlier flowering initiation and longer flowering periods. The model exhibited robust performance in tracking rice panicles,, with approximately 70% of panicles tracked continuously and completely, despite environmental changes. The study also highlighted the effect of nitrogen on rice heading and flowering, indicating potential impacts on grain filling. It was observed that nitrogen application increases the panicle number but also affects grain filling initiation and duration.
In conclusion, the proposed pipeline demonstrates a non-destructive, accurate, and efficient approach to obtaining panicle traits. It opens new avenues for analyzing rice phenotypes under different nitrogen treatments and environmental conditions, thereby aiding in the advancement of agronomic research and cultivation practices.
Read the paper: Plant Phenomics
Article source: Nanjing Agriculturel University, The Academy of Science via EurekAlert
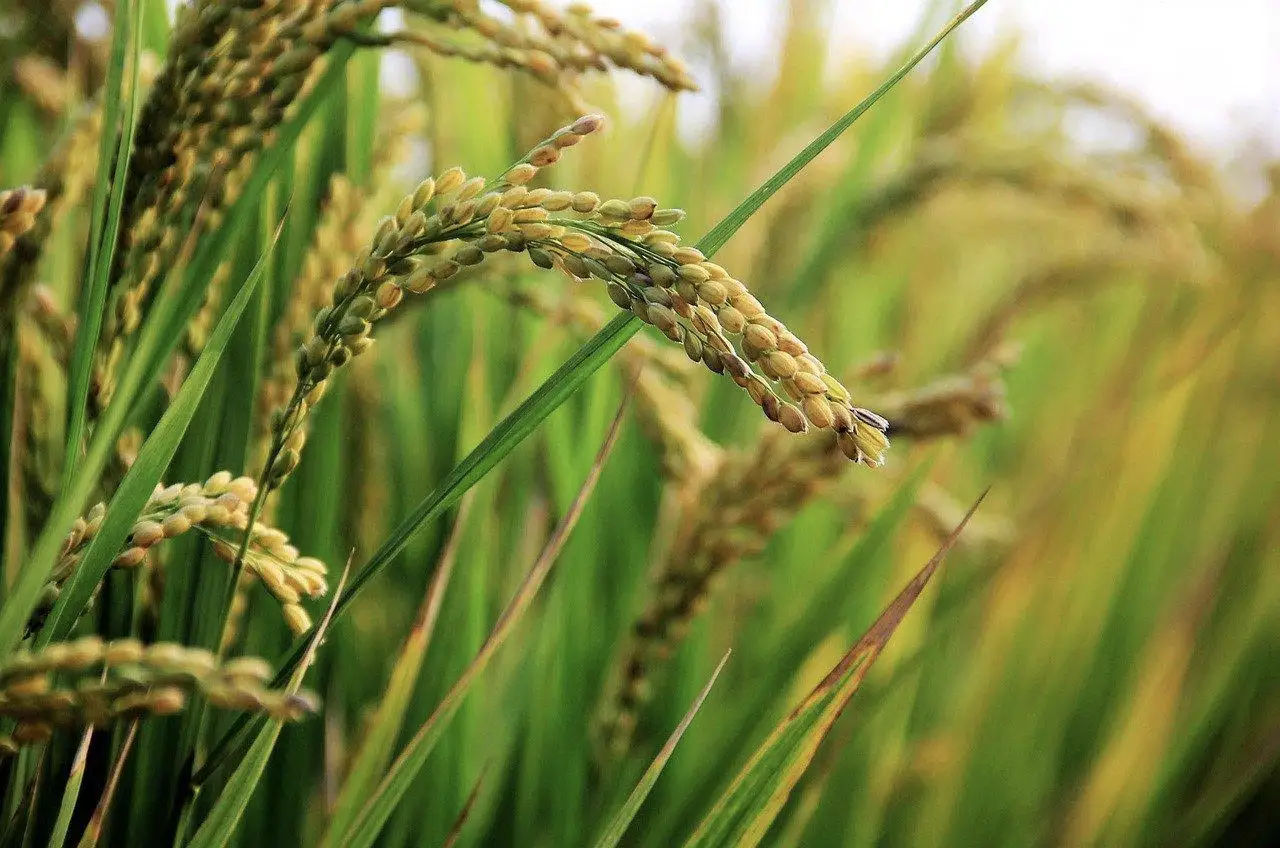
Image: Rice field image. Credit: Pixabay