New research by Monash University experts has tracked Japanese hanami (flower viewing) via social media images, producing an unprecedented map of cherry blossoms across Japan to document their annual bloom and calculate its peak in major cities.
Flowering plants like Japanese cherry blossoms provide important resources for insect pollinators but their flowering behaviour is shifting as our climate changes, potentially causing problems for the insects that pollinate them. This is one reason why it is important to study tree flowering times. Changes to blooming patterns can also be used as indicators of the impact of climate variation.
Published recently in Flora, the study gathered ten years of hanami images from social network sites (SNS) posted between 2008 to 2018 and compared the data with official records of cherry flowering times in Japan, to determine if social media data could be used as a log of tree bloom timing.
The study revealed a detailed seasonal pattern of cherry blossoms blooming from southern to northern Japan over a 12-week period between March and May, and also showed subtle off-season blooms in the form of the unexpected appearance of flowers in November.
Research co-author Associate Professor Adrian Dyer said traditional research methods of measuring changes in flowering patterns of plants require intense effort over long periods of time and across considerable distances, making the research too expensive to carry out.
“This research demonstrates that it is possible to use contemporary sources, like images from social media, to understand environmental events like flowering patterns,” Associate Professor Dyer said.
“Through this new approach we are able to accurately map large scale patterns across broad distances and also gain detailed perspectives on subtle flowering patterns.”
The researchers collected images from Flickr that were uploaded by users tagged as ‘Cherry Blossoms’. Computer vision and AI algorithms were applied to the images to filter out those that were irrelevant.
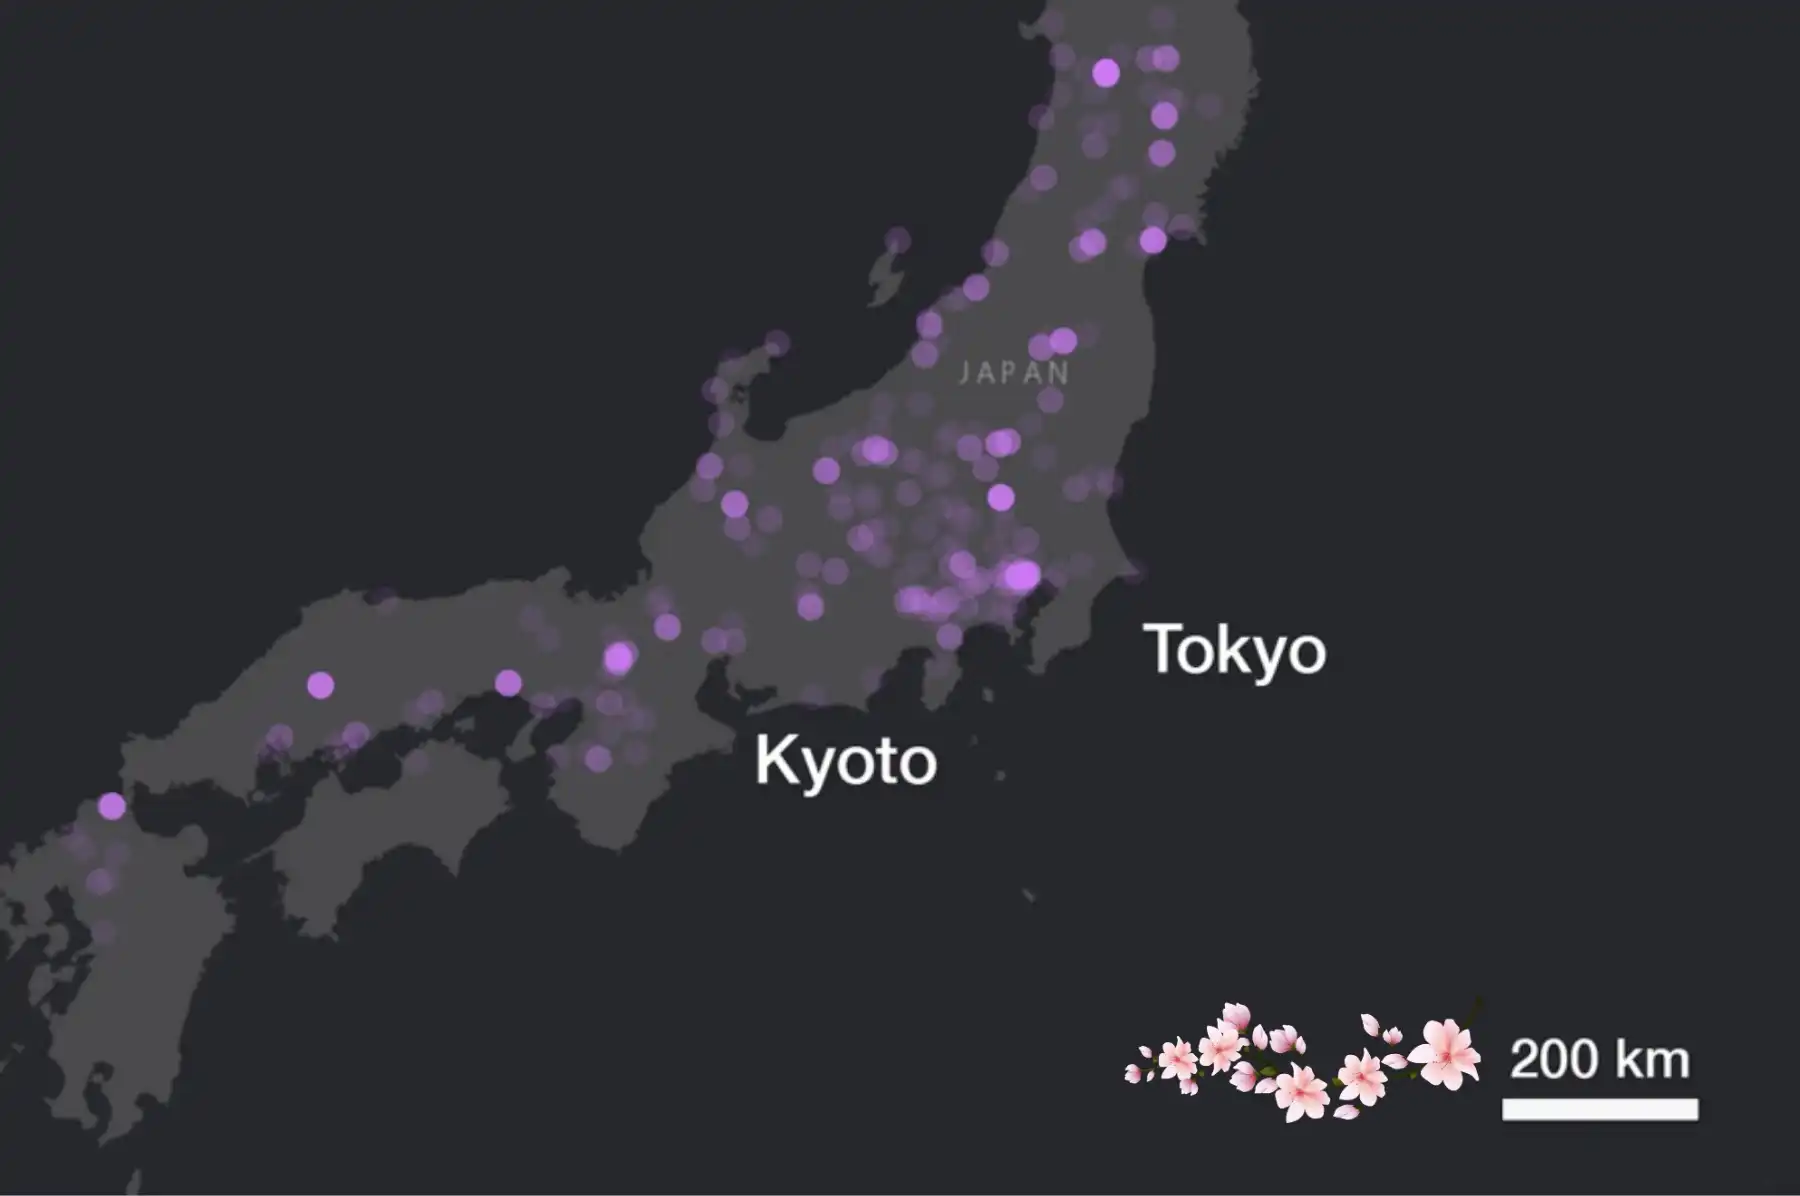
Research co-author Associate Professor Alan Dorin, from the Faculty of Information Technology, said the time stamps and GPS location tags on the filtered images were then used to generate points across a map of Japan showing the seasonal wave of blooms, and to estimate peak bloom times each year in different cities.
“We found our research results to be accurate within a few days when compared against historical flowering data published by the Japan National Tourism Organisation,” Associate Professor Dorin said.
“We are confident this method could be replicated to understand other photogenic ecological patterns and help record the environmental impacts of climate change.”
The researchers are looking to apply this research method to other natural events like the flowering patterns of native Australian plants in the future.
Read the paper: Flora
Article source: Monash University
Image: A map of Japan with markings indicating the locations of cherry blossom spots.Credit: Monash University