When biologist Elizabeth Carlen pulled up in her 2007 Subaru for her first look around St. Louis, she was already checking for the squirrels. Arriving as a newcomer from New York City, Carlen had scrolled through maps and lists of recent sightings in a digital application called iNaturalist. This app is a popular tool for reporting and sharing sightings of animals and plants.
People often start using apps like iNaturalist and eBird when they get interested in a contributory science project (also sometimes called a citizen science project). Armed with cellphones equipped with cameras and GPS, app-wielding volunteers can submit geolocated data that iNaturalist then translates into user-friendly maps. Collectively, these observations have provided scientists and community members greater insight into the biodiversity of their local environment and helped scientists understand trends in climate change, adaptation and species distribution.
But right away, Carlen ran into problems with the iNaturalist data in St. Louis.
“According to the app, Eastern gray squirrels tended to be mostly spotted in the south part of the city,” said Carlen, a postdoctoral fellow with the Living Earth Collaborative at Washington University in St. Louis. “That seemed weird to me, especially because the trees, or canopy cover, tended to be pretty even across the city.
“I wondered what was going on. Were there really no squirrels in the northern part of the city?” Carlen said. A cursory drive through a few parks and back alleys north of Delmar Boulevard told her otherwise: squirrels galore.
Carlen took to X, formerly Twitter, for advice. “Squirrels are abundant in the northern part of the city, but there are no recorded observations,” she mused. Carlen asked if others had experienced similar issues with iNaturalist data in their own backyards.
Many people responded, voicing their concerns and affirming Carlen’s experience. The maps on iNaturalist seemed clear, but they did not reflect the way squirrels were actually distributed across St. Louis. Instead, Carlen was looking at biased data.
Previous research has highlighted biases in data reported to contributory science platforms, but little work has articulated how these biases arise.
Carlen reached out to the scientists who responded to her Twitter post to brainstorm some ideas. They put together a framework that illustrates how social and ecological factors combine to create bias in contributory data. In a new paper published in People & Nature, Carlen and her co-authors shared this framework and offered some recommendations to help address the problems.
The scientists described four kinds of “filters” that can bias the reported species pool in contributory science projects:
- Participation filter. Participation reflects who is reporting the data, including where those people are located and the areas they have access to. This filter also may reflect whether individuals in a community are aware of an effort to collect data, or if they have the means and motivation to collect it.
- Detectability filter. An animal’s biology and behavior can impact whether people record it. For example, people are less likely to report sightings of owls or other nocturnal species.
- Sampling filter. People might be more willing to report animals they see when they are recreating (i.e. hanging out in a park), but not what they see while they’re commuting.
- Preference filter. People tend to ignore or filter out pests, nuisance species and uncharismatic or “boring” species. (“There’s not a lot of people photographing rats and putting them on iNaturalist — or pigeons, for that matter,” Carlen said.)
In the paper, Carlen and her team applied their framework to data recorded in St. Louis as a case study. They showed that eBird and iNaturalist observations are concentrated in the southern part of the city, where more white people live. Uneven participation in St. Louis is likely a consequence of variables, such as race, income, and/or contemporary politics, which differ between northern and southern parts of the city, the authors wrote. The other filters of detectability, sampling and preference also likely influence species reporting in St. Louis.
Biased and unrepresentative data is not just a problem for urban ecologists, even if they are the ones who are most likely to notice it, Carlen said. City planners, environmental consultants and local nonprofits all sometimes use contributory science data in their work.
“We need to be very conscious about how we’re using this data and how we’re interpreting where animals are,” Carlen said.
Carlen shared several recommendations for researchers and institutions that want to improve contributory science efforts and help reduce bias. Basic steps include considering cultural relevance when designing a project, conducting proactive outreach with diverse stakeholders and translating project materials into multiple languages.
Data and conclusions drawn from contributory projects should be made publicly available, communicated in accessible formats and made relevant to participants and community members.
“It’s important that we work with communities to understand what their needs are — and then build a better partnership,” Carlen said. “We can’t just show residents the app and tell them that they need to use it, because that ignores the underlying problem that our society is still segregated and not everyone has the resources to participate.
“We need to build relationships with the community and understand what they want to know about the wildlife in their neighborhood,” Carlen said. “Then we can design projects that address those questions, provide resources and actively empower community members to contribute to data collection.”
Read the paper: People and Nature
Article source: Washington University in St. Louis
Author: Talia Ogliore
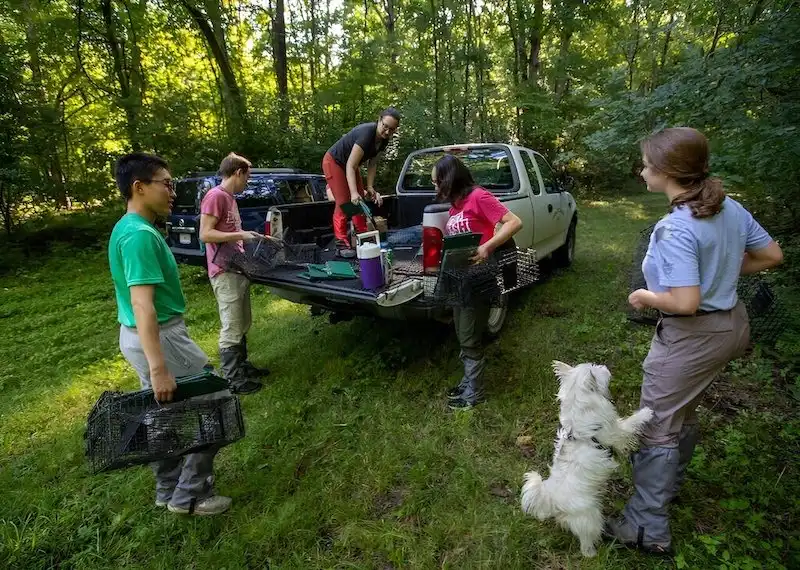
Image: Biologist Elizabeth Carlen, standing in the back of a truck bed, distributes supplies to members of her squirrel trapping team at Tyson Research Center, Washington University’s environmental field station. Carlen is studying how Eastern gray squirrels are adapting to the urban environment in St. Louis. Credit: Joe Angeles/Washington University


